Over 120 Wine Descriptions on a subway style design. Learn wine flavors and what they really mean.
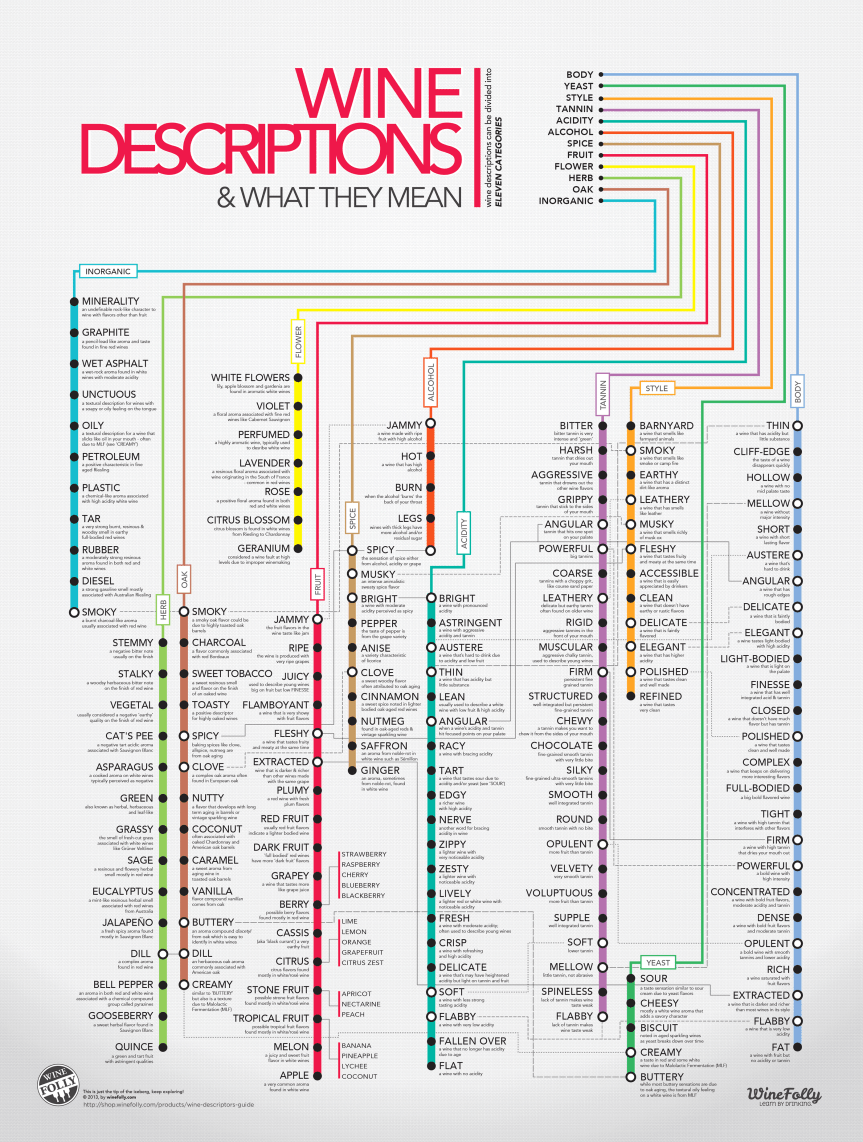
Source: winefolly.com
Over 120 Wine Descriptions on a subway style design. Learn wine flavors and what they really mean.
Source: winefolly.com
This infographic shows the change in frequency of visits at at sit down restaurants such as Red Lobster and TGI Fridays with fast food joints such as Burger King, KFC and Dominos Pizza. Both categories grew in the second quarter of 2009, with fast food taking the lead over sit down.

There will soon be seven billion humans on Earth, but how does that number compare to other species on the planet? We are certainly outnumbered by ants. Harvard biologist and ant expert Edward O. Wilson has estimated that there are a thousand trillion to ten thousand trillion ants at any one time.* That would be about a million ants for every one of us. And doesnt it seem like that when they invade our kitchens? Estimating animal populations, especially wild ones, is hard, but heres a look at one category of animals we can count: the ones we eat. Nigel Holmes