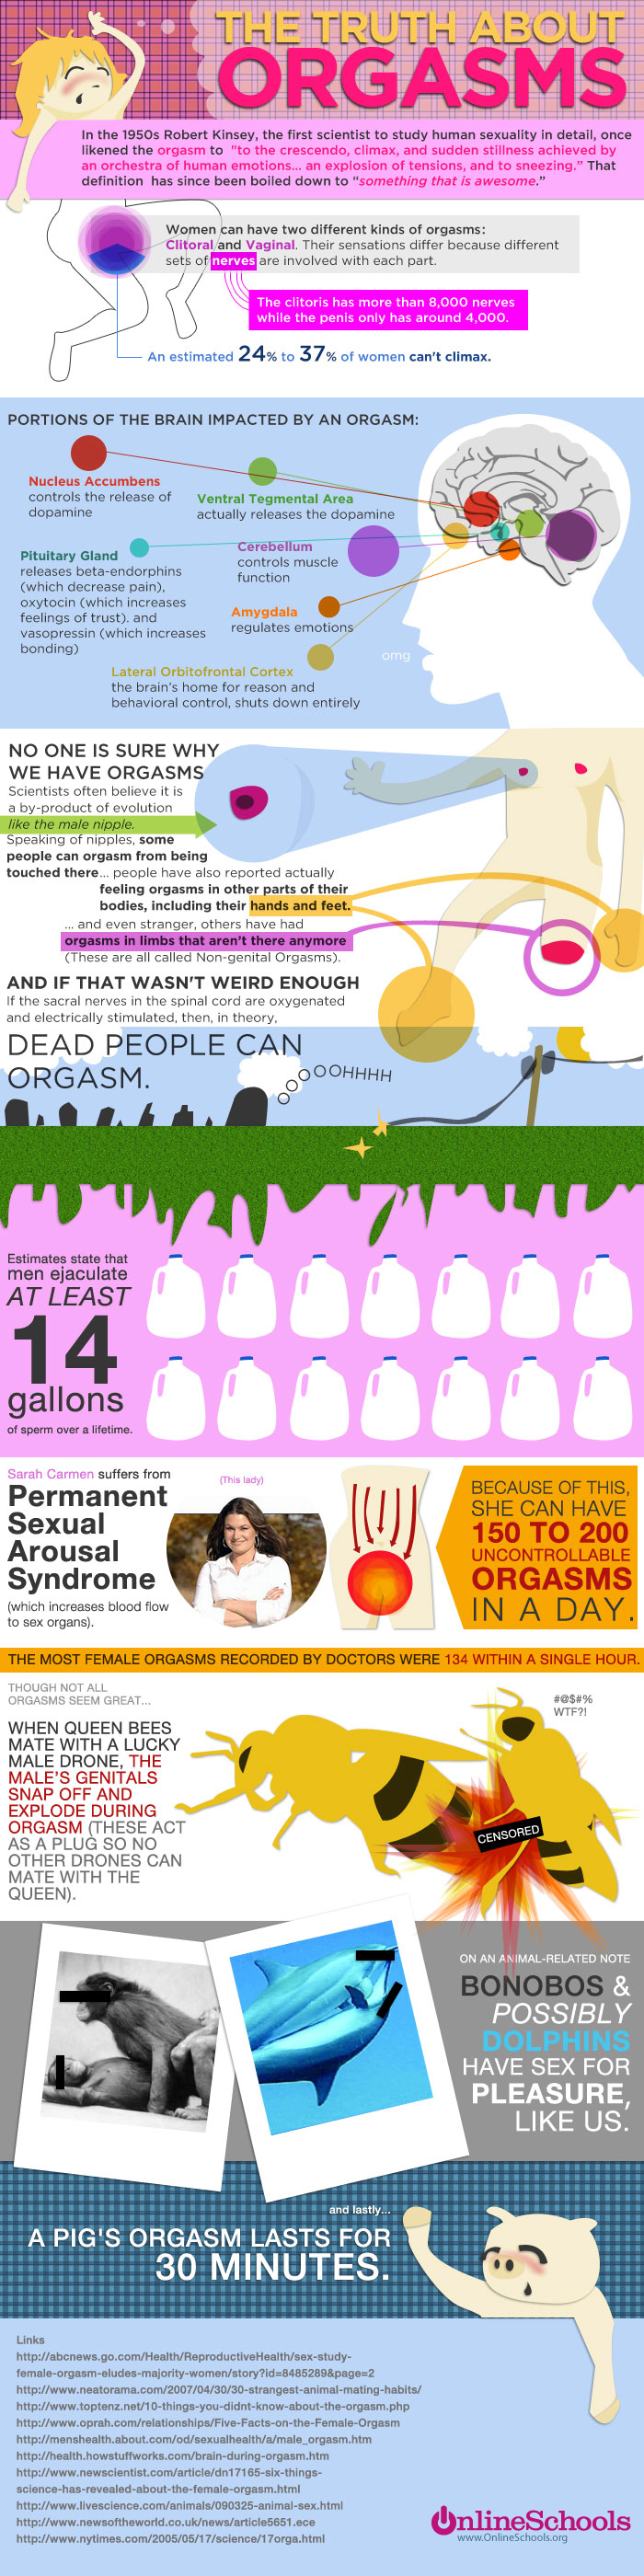
This infographic gives all the facts and information about an orgasm. It shows the portion of the brain that’s impacted by an orgasm and other odd facts about orgasms.
This infographic gives all the facts and information about an orgasm. It shows the portion of the brain that’s impacted by an orgasm and other odd facts about orgasms.
The phrase You are what you eat, does have a ring of truth to it whether you want to admit it to yourself or not. This infographic breaks down the caloric intake of what you eat in a day and shows you how much physical activity you need to do to burn off that glass of red wine or ballpark hot dog. By keeping track of what you eat and how much you burn, youll be able to see results in no time.

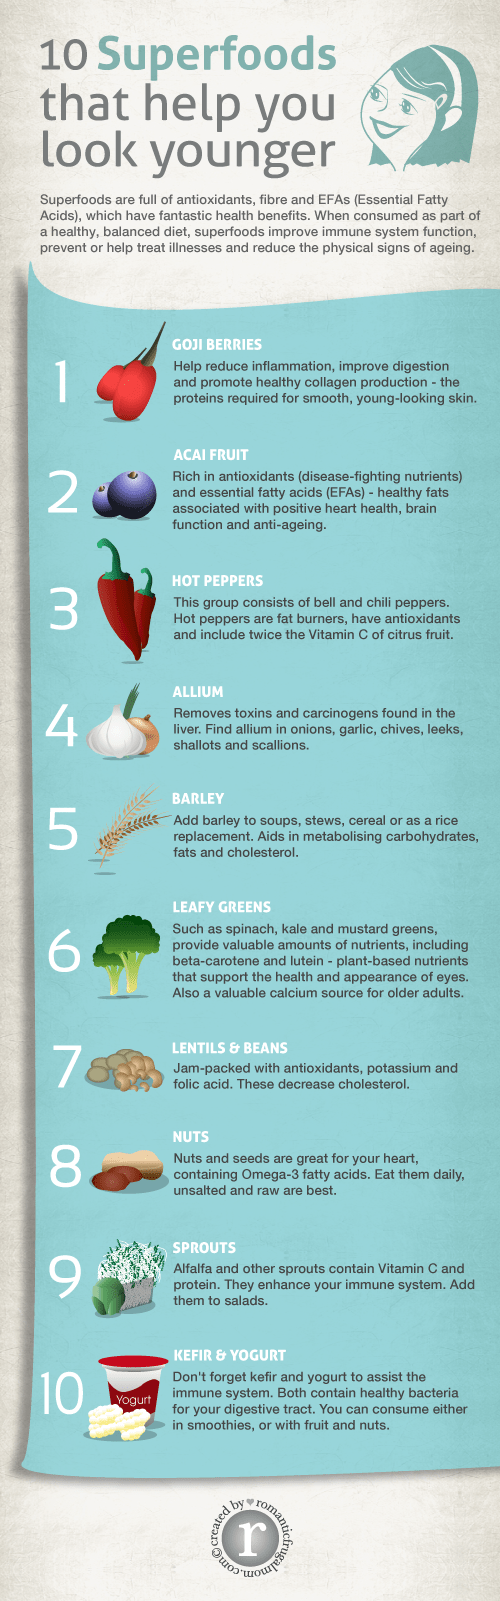
I am a bit of a late convert to the superfoods regimen. I tend not to be someone who jumps on the bandwagon of every new cure and health fad that comes along. But I have to say the argument for superfoods has won me over with time for two simple reasons:
1. The science is pretty sound
2. The superfoods all taste great so to hell with the health stats anyway! If theyre doing something good for our families health then great, if not, still great!
So there you have a Grace Pamer Superfoods 101 spot check argument. Succinct, to the point and lacking in empirical evidence. Enjoy!
Source: romanticfrugalmom.com
Designer Ryan MacEachern shows his eating habits via colourful, food-filled and data-rich graphics.
The photography-approach brings the details of carbohydrates, fat and protein in MacEachern’s diet to visual life in a way that a dry graph never could.

Source: ryanmaceachern.tumblr.com
